Quick Answer
Most retirement advice hands you a single number: a withdrawal rate, a savings target, a magic percentage. But what if your plan looks solid by one measure and shaky by another? Real confidence does not come from one number. It comes from the same plan agreeing with itself across several independent tests.

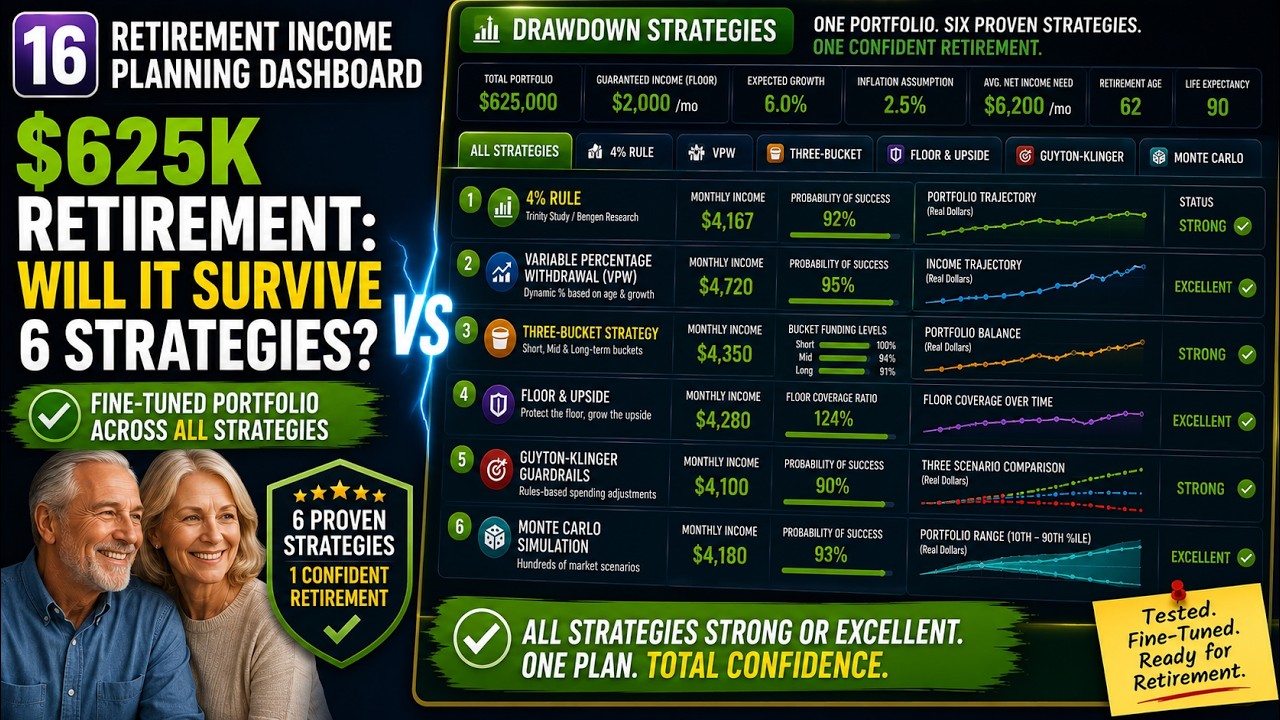
The AI Retirement Income Planner has two tabs built for this. The Drawdown strategies tab runs your plan through six of the most tested withdrawal frameworks at once. The Stress test tab throws bad markets and high inflation at it. When the 4% rule, variable withdrawals, buckets, floor-and-upside, guardrails, and a Monte Carlo simulation all point the same way, and the plan survives the stress grid, you move from hoping your plan works to knowing it does. This guide shows how to use both.
Key Takeaways
- One test is not enough. A plan can pass the 4% rule but fail Monte Carlo, or vice versa. Convergence across several frameworks is the real signal.
- Everything runs on your actual numbers. There is no separate data entry. Each strategy compares itself against your plan's average net monthly income.
- The key reading is "versus your plan." When a strategy's suggested spending lands close to your plan's income, you are calibrated. A consistent gap tells you which way to adjust.
- A guaranteed floor changes everything. The more of your income that comes from Social Security and pensions, the less the market can hurt you, and the better most of these strategies look.
- Stress-test before you commit. A plan that only works in good markets is not a plan. The stress grid shows where it is fragile before that fragility becomes real.
Where These Tools Live, and How They Read Your Plan
Both tools sit in the planner's tab row: Drawdown strategies and Stress test. The important thing to understand is that neither asks you to re-enter anything. They both run on the plan you have already built, so once you have a baseline (see the step-by-step setup guide), you can pressure-test it immediately.
At the top of the Drawdown tab is a summary of the inputs driving the analysis: your total investable portfolio by account type, your guaranteed income floor (Social Security, pensions, anything that does not depend on markets), and your key assumptions. And critically, your plan's average net monthly income becomes the benchmark every strategy is measured against. The most useful number on every screen is "versus your plan": when it reads close to zero, your plan is calibrated to that framework.
Strategy 1: The 4% Rule
The most cited number in retirement planning. Drawn from the Trinity study and William Bengen's research, it says that withdrawing 4% of your portfolio in year one and adjusting that dollar amount for inflation thereafter has historically survived 30-year retirements around 95% of the time.
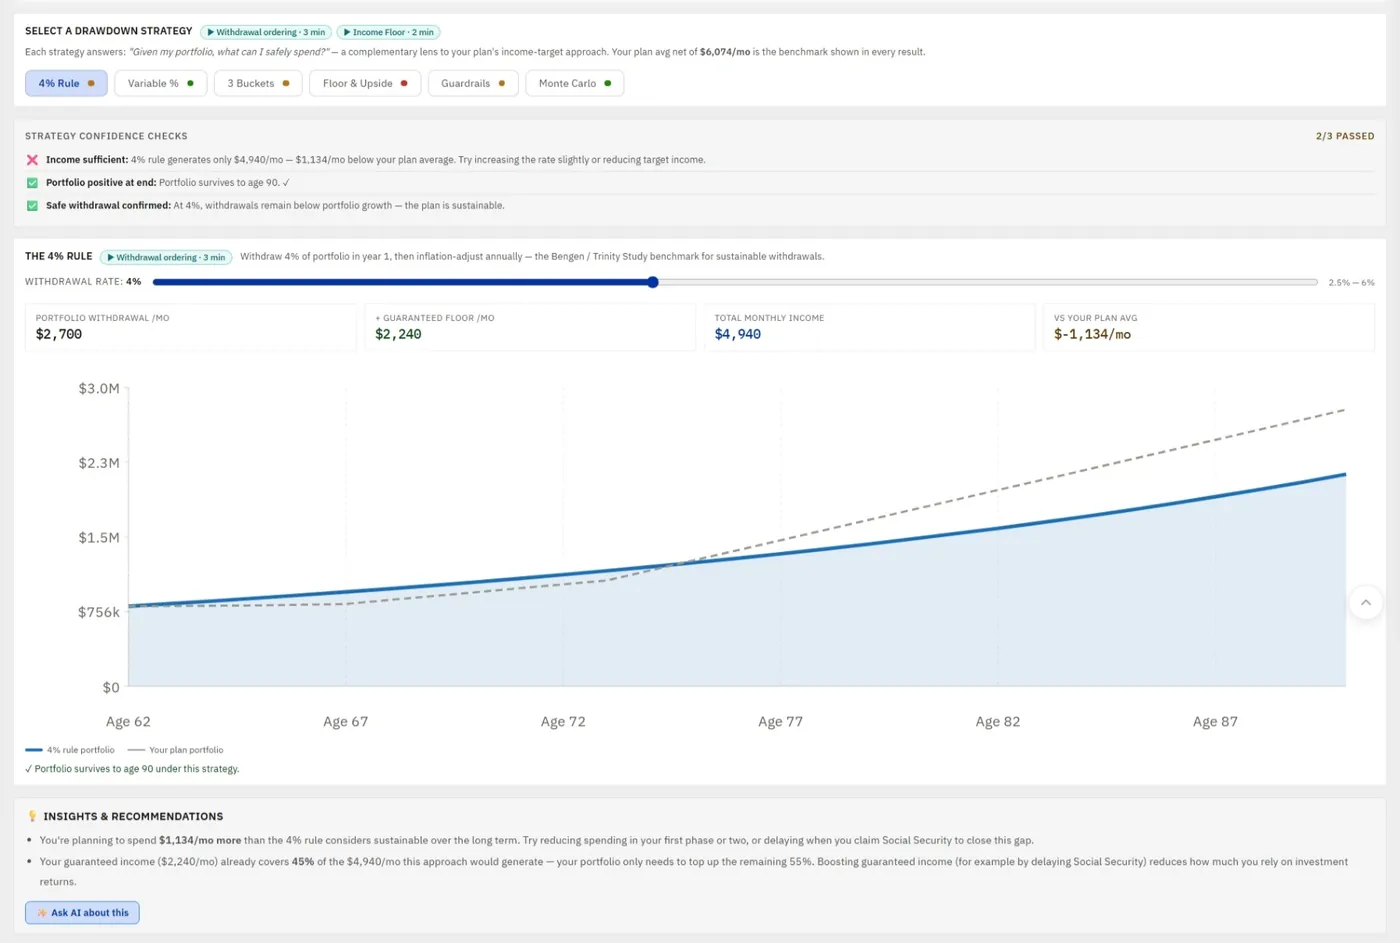
In the planner, the 4% rule tells you whether your plan's spending is inside that safe zone. If your plan withdraws more than the rule suggests, it flags by how much; if less, it tells you that you may be planning conservatively and could spend more. There is a slider to test other rates: run it until the "versus your plan" card reads close to zero, and that is the rate the research says matches your income target. If that rate is at or below about 4.5%, your plan is historically safe by this benchmark.
Strategy 2: Variable Percentage Withdrawal
The 4% rule has one known weakness: it is rigid and ignores what markets actually do. Variable Percentage Withdrawal (VPW) fixes that by withdrawing a percentage of your remaining portfolio each year, calibrated to your growth rate and remaining years. As you age, the percentage rises, and the math is designed so the portfolio reaches roughly zero at your life expectancy: no money left unspent, no risk of outliving it.
VPW income tends to rise over time, which reflects reality for many retirees whose costs shift later in life. It is self-correcting, a strong year raises next year's income, a poor year trims it, so it suits people who can be flexible about spending but feels uncomfortable if you need the exact same amount every month. Your guaranteed floor cushions the variable part.
Strategy 3: The Three-Bucket Approach
Less about math, more about behavior, and that is exactly why it works. You divide the portfolio into three time-segmented buckets: bucket one holds a few years of expenses in cash and is the only one you draw from; bucket two holds medium-term money and refills bucket one; bucket three is long-term growth that you do not touch for years.
The planner maps your existing balances to these buckets, cash to bucket one, and shows how fully funded each is against its target. The genius is psychological: when markets crash 30% in your first year, you draw from cash rather than selling growth assets at the worst possible moment. If bucket one is underfunded, that is the most urgent thing to address before retiring, because that cash buffer is your protection against a bad sequence of returns early on.
Strategy 4: Floor and Upside
This is the strategy most aligned with how the planner is already built. It splits your income into two tiers: a floor that never depends on markets (Social Security, pensions, guaranteed income) and upside that your portfolio must supply to reach your target.
The key metric is the coverage ratio: what percentage of your average monthly income is genuinely guaranteed. Above about 60% is strong downside protection; above 80% is exceptional. The planner shows this per phase, and because Social Security and pensions activate at different points, the coverage typically rises as retirement progresses, so the plan gets stronger over time, not weaker. Building that reliable floor is one of the most valuable moves in a plan, closely related to which accounts you rely on and when.
Strategy 5: Guyton-Klinger Guardrails
Guardrails solve a real problem: the 4% rule often leaves large sums unspent because it is too conservative, but simply raising the rate adds risk. Guardrails thread the needle by starting higher, around 5%, with two automatic safety valves. If markets fall enough that your withdrawal rate climbs above a ceiling, you cut spending by 10%. If they rise enough that your rate drops below a floor, you give yourself a 10% raise.
The planner shows what you would receive at the start, after a maximum cut, and after a raise, plus how many cuts and raises each simulated market path triggers. If even the worst-case cut keeps your income within about 15% of your plan average, your spending is flexible enough for guardrails to work comfortably. This dynamic-spending idea has its own deeper guide.
Strategy 6: Monte Carlo
Monte Carlo ties everything together. Instead of assuming one fixed return, it runs your full plan hundreds of times with randomized return sequences drawn from historical volatility, the way markets actually behave, with good years and bad years in unpredictable order.
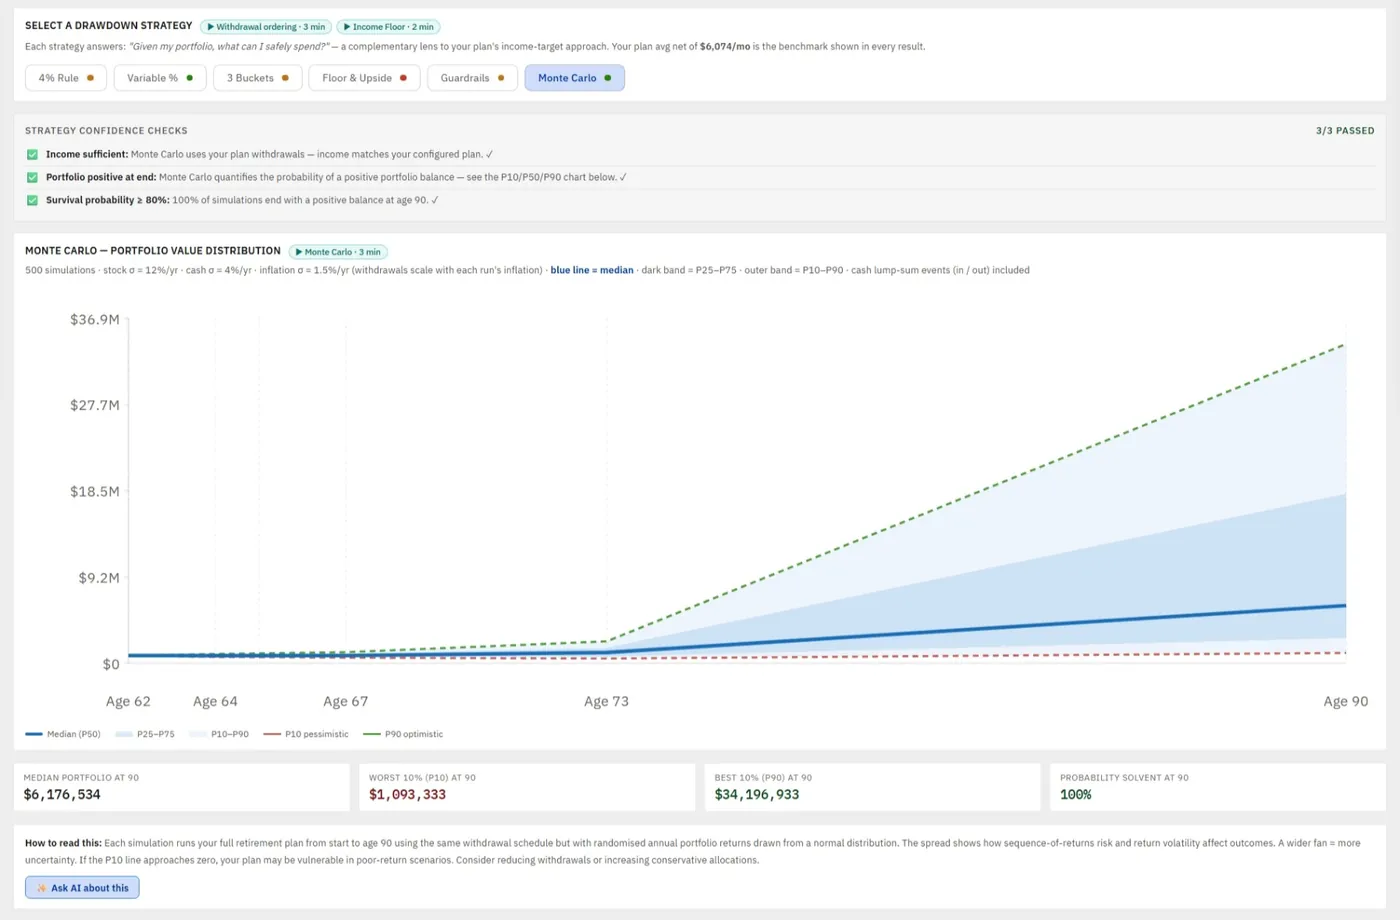
The fan chart shows the full range of outcomes: a median line, bands for the middle 50% and 80%, and a bottom-10% line that is your realistic worst case. The headline number is the probability of success, the share of runs that end with money still in the pot. Above about 80% is a strong result; below about 65% is a signal to reduce withdrawals or extend your timeline. Monte Carlo pairs naturally with a historical backtest that replays real market sequences, and the two together are stronger than either alone.
The Stress Test: Bad Markets and High Inflation
The Drawdown strategies ask "what can I safely spend?" The Stress test tab asks the harder question: "what happens when conditions turn against me?"
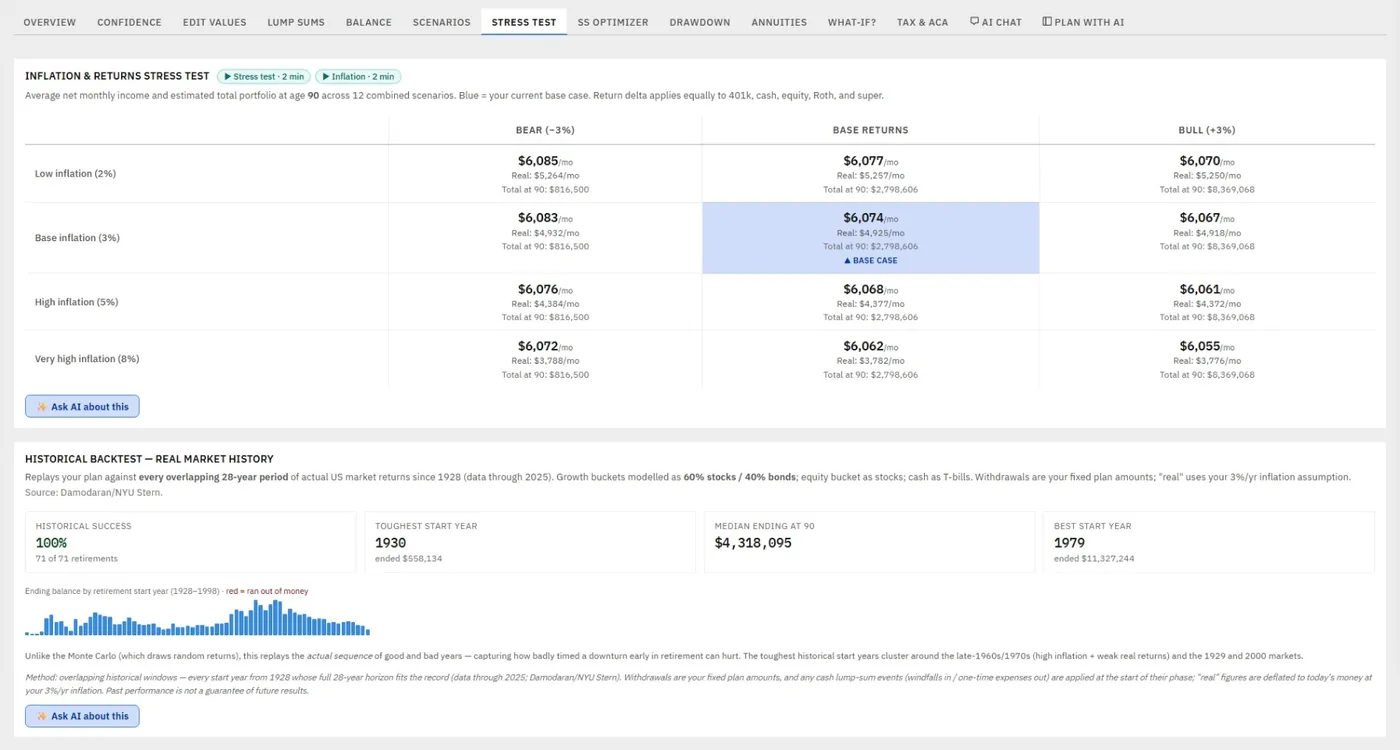
It runs your plan across twelve combined scenarios, pairing lower and higher return assumptions with a range of inflation levels, and shows your average net monthly income and ending portfolio in each. Your current base case is the reference point. What you are watching for is not whether every scenario is comfortable, some will show reduced late-life balances, but whether the plan's income floor stays intact throughout. A plan whose guaranteed income holds up even when the portfolio suffers is the definition of a resilient plan. That is the payoff of building a strong floor: the moment Social Security activates, the income picture stabilizes even in a bad market.
Reading All Six Together
The point of running six strategies is not more numbers. It is convergent evidence from independent frameworks all pointing to the same conclusion. A practical order to use them:
- Start with the 4% rule. Find the rate that matches your income target. Below about 4.5% is historically safe.
- Check floor and upside. A coverage ratio above 50% means guaranteed income is meaningfully reducing your market risk.
- Fund your buckets. If bucket one is short, address that before retiring.
- Run Monte Carlo. Above about 80% probability and the other strategies are telling a consistent story.
- Use VPW and guardrails as optional refinements for flexibility.
When all six broadly agree, the safe rate is sustainable, the floor is solid, the buckets are funded, and Monte Carlo clears 80%, that agreement is what confidence actually looks like. This is the same idea as checking a plan from several angles, and it complements the deeper look at comparing withdrawal strategies. The planner also rolls these signals into its Plan Health checks and confidence score, which flag the same risks automatically as you edit and rate each drawdown strategy against your plan. None of it predicts the future. Its value is showing where a plan is fragile before that fragility becomes a real problem, and telling you, when everything lines up, that you can move from hoping to knowing.
FAQ
What is the difference between the drawdown strategies and the stress test?
The Drawdown strategies tab answers "what can I safely spend?" by running your plan through six withdrawal frameworks and comparing each against your plan's income. The stress test answers "what happens if conditions turn bad?" by running your plan across twelve combined return and inflation scenarios. One calibrates your spending; the other checks resilience. Used together they give a fuller picture than either alone.
Do I have to enter my numbers separately for each strategy?
No. Both tools run entirely on the plan you have already built. Each strategy pulls your portfolio, guaranteed income floor, and assumptions automatically, and compares its result against your plan's average net monthly income. You just switch between strategies and read the results.
What is a good Monte Carlo success rate?
Above about 80% is generally considered a strong result, and above 90% is exceptional. Between roughly 65% and 80% is moderate, and below about 65% is a signal to reduce withdrawals, delay retirement, or build a larger guaranteed income floor before relying on the plan. The figure is an educational estimate, not a guarantee.
Which drawdown strategy should I actually use?
The tool is not built to pick one for you. Its value is showing whether the strategies agree. If the 4% rule says your spending is safe, floor coverage is solid, buckets are funded, and Monte Carlo clears 80%, that convergence matters more than which single framework you nominally follow. Where they disagree, you have a clear signal about what to adjust.
Why does a bigger guaranteed income floor make my plan look safer?
Because guaranteed income, Social Security and pensions, does not move with the market. The more of your spending it covers, the less your portfolio has to do under pressure. In the stress test, the floor is what stabilizes your income even when returns are poor, and in floor-and-upside a coverage ratio above 60% means the majority of your income is effectively untouchable.
Source Links
- Investor.gov, Retirement Planning: https://www.investor.gov/introduction-investing/general-resources/retirement-toolkit
- Bogleheads, Variable Percentage Withdrawal: https://www.bogleheads.org/wiki/Variable_percentage_withdrawal
- Investor.gov, Save and Invest: https://www.investor.gov/financial-tools-calculators/calculators
- AI Retirement Income Planner: https://airetirementincomeplanner.com/
Educational Disclaimer
This article is for general education only. It is not financial, tax, investment, legal, healthcare, Social Security, Medicare, estate, or retirement advice. It does not provide personalized recommendations. All withdrawal strategies, simulations, and stress tests are illustrative estimates based on the assumptions entered, not predictions or guarantees of future results. Markets are uncertain. Consult qualified financial professionals before making significant financial decisions.