
Quick Answer
Retirement income has hard edges. Earn one dollar too much and an ACA subsidy can vanish. Convert slightly too much at 63 and a Medicare surcharge appears at 65. Withdraw slightly too little at 75 and there is an IRS penalty. Spend from an account that quietly emptied four years ago and your plan is paying you money that does not exist.
None of those edges announce themselves in a spreadsheet. You find them afterwards, in a tax bill or an insurance letter.
A guardrail is a small badge, colored figure, or warning line that appears on a plan because of the numbers you entered — flagging an edge while you can still do something about it. Read as a group, they answer four questions:
- Can this plan physically pay? Is any account being asked for money it does not have?
- Am I leaving money on the table? Is income sitting just the wrong side of a threshold?
- Is a penalty or surcharge coming? RMD minimums, IRMAA surcharges.
- Is this really enough? Not the headline figure — the figure after tax, healthcare, and inflation.

One point of clarification before we start, because the word gets used two ways. This article is about the warnings a plan displays. A withdrawal guardrail is something different: a spending rule you set in advance, such as cutting discretionary spending by ten percent if the portfolio falls below a set level. Both are useful. Only one is what your plan shows you while you build it.
Key Takeaways
- Amber is the useful color. Red means you have already crossed something. Amber fires before anything is wrong, while a change still costs nothing.
- A warning is not a verdict. "Cash runs out at 69" may be exactly what you intended if cash is a bridge to Social Security. The guardrail's job is to make sure it was a decision, not an accident.
- The dangerous edges are invisible ones. Nothing in your income tells you that MAGI is $400 under a cliff. A guardrail can, because it knows both numbers.
- Zero is not always failure. An account you deliberately left out of the plan and an account your withdrawals drained look identical on a balance line. Good guardrails distinguish them.
- Thresholds move every year. Brackets, FPL levels, and IRMAA tiers are inflation-adjusted, so a guardrail has to compare your income against the threshold for that year, not today's.
- The warning should explain itself. A flag that only says "warning" trains you to ignore it. A flag that shows the two numbers it compared teaches you the rule.
Guardrail Family 1: Can This Plan Physically Pay?
This is the most basic question and the easiest to get wrong, because most retirement projections will happily keep paying you from an empty account. The arithmetic still works — a negative balance floored at zero, an income figure that never dips — and the plan looks solvent to the last year.
The honest version caps every withdrawal at what the account actually holds. Once it does, two things need flagging.
The account cannot fund what you asked for. You set $100 a month from cash; the account can only supply $48, because it runs dry partway through the phase.
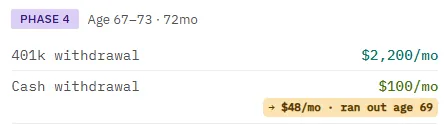
Notice what the warning does not do: it does not rewrite your number. Your $100 stays exactly as you typed it, with the achievable figure shown beside it and the age the account ran out. That matters more than it sounds. If you are experimenting with heavier early spending, you want to be able to reverse the experiment cleanly — and you cannot reverse an edit the software made for you while your back was turned.
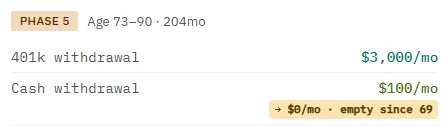
In a later phase the wording shifts from "ran out at age 69" to "empty since 69" — the same shortfall, but telling you the money was already gone before this phase began. That is your cue to look earlier in the plan, not here.
Nothing could cover a one-time expense. A new roof, a car, a year of long-term care. A plan draws these from cash first, then equity, then tax-deferred accounts. When the expense exceeds every account combined, the remainder has to be reported as unfunded.
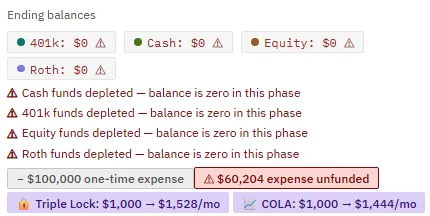
This is the hardest failure a plan can report, and notice it never appears alone. Every account has been drained to zero to try to cover the bill, so the same card carries a depletion flag for each one. That crowding is the honest picture: an unfunded expense is not one problem, it is the moment a plan runs out of options.
Access is a constraint too. Before 59½, tax-deferred withdrawals generally carry a 10% penalty. A plan modeling early retirement should never let you spend from that account as though the penalty did not exist — either hold it back, or charge the 10% and show it. What it must not do is quietly understate the cost.
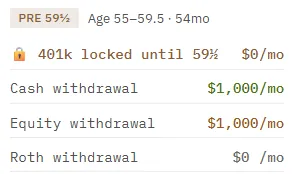
Note what that forces: retiring at 55 means the first four and a half years have to be funded from cash and taxable accounts, and here they are — $1,000 a month from each. That constraint is the whole reason early retirement needs a bridge, and it is visible before you have committed to anything. This is a guardrail that stops you from planning a penalty, which is the cheapest possible moment to catch one.
And zero can be a choice. If you have no brokerage account, a zero equity line is simply a fact about your plan. If your withdrawals emptied one, that is news. A plan that renders both the same way is throwing away the distinction.
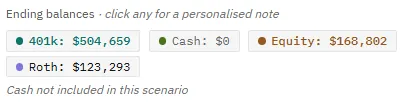
Compare that with the image two above it. Both show a zero balance. This one has healthy six-figure balances beside it, the zero is grayed rather than red, there is no warning icon, and a quiet italic note says not included in this scenario. The absence of red is the message.
The deeper point is that solvency is not one number at the end. It is a question you can ask of every account in every phase, which is the whole argument for reading a plan as a timeline of phases rather than a single sustainable-withdrawal figure. Ending balances are what carry a plan forward, and they deserve reading in their own right.
Guardrail Family 2: Am I Leaving Money on the Table?
The first family is about running out. This one is about paying more than you needed to — and it is where the money usually is, because these thresholds are invisible from inside your own budget.
Before Medicare, health insurance costs move with income. Cross 400% of the federal poverty level and premium subsidies stop entirely — the "subsidy cliff", and one of the few places in the tax code where one extra dollar of income can cost thousands. Below 250% FPL, Silver plans carry cost-sharing reductions that cut deductibles and out-of-pocket maximums, often worth several thousand a year on their own.
So the useful guardrails are a status pair — are you above the 100% FPL floor, and are you inside the CSR band — plus the number that actually lets you act: how much headroom is left.
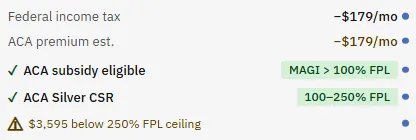
That amber line is doing the real work. Both statuses are green; nothing is wrong. But MAGI is $3,595 under the ceiling, and $3,595 is not much. A year-end capital-gains distribution from a fund you do not control, a slightly larger dividend, a bit of taxable rebalancing — any of them could tip you over and forfeit the cost-sharing help for the whole year. You cannot see that risk in a status badge. You can see it in a dollar figure.
There are several of these boundaries stacked up — the 150% and 200% FPL steps where cost-sharing gets less generous, the 250% ceiling, the 400% cliff — and only the one you are currently sitting under is worth flagging. Warning about all four at once is noise.
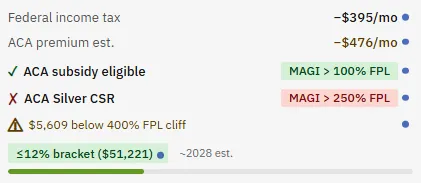
Here the same guardrail has moved up a boundary. Cost-sharing is already gone — MAGI is above 250% FPL — so the flag now measures the distance to the next edge, the 400% cliff, with $5,609 of headroom. The stakes are higher at this one: crossing 250% costs you cost-sharing help, crossing 400% costs you the premium subsidy entirely.
When you are over a line, the tone should change from caution to fact:
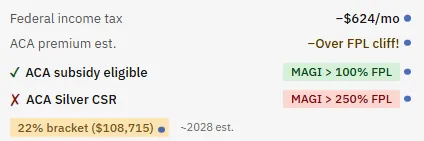
The premium estimate is replaced by the reason it cannot be estimated: over the cliff, no subsidy. Cost-sharing is marked with a red cross. And the bracket badge has gone amber at 22%, which is the same story told twice — the income that pushed you past the healthcare threshold also pushed you into a higher bracket. Seeing both on one card is how you learn that a withdrawal decision is rarely just a tax decision. Our article on how healthcare costs move with income follows that thread further.
Tax position deserves the same treatment. A bracket badge that is green inside the 12% band and amber above it tells you at a glance which phases have low-bracket space left — the space that makes Roth conversions cheap. And one line under it catches something most people miss entirely:
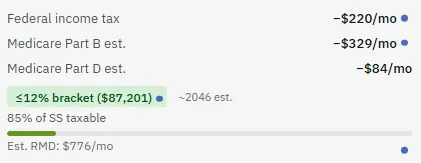
85% of SS taxable is the Social Security tax torpedo in five words. Social Security is taxed on a sliding scale driven by your other income: at low income none of it is taxable, and as other income rises, more of the benefit becomes taxable — up to 85%. The effect is that an extra $1,000 withdrawal can make several hundred dollars of previously untaxed benefit taxable, so your real marginal rate is meaningfully higher than your bracket suggests. A plan that shows only the bracket hides that. How taxes change the shape of retirement income covers the mechanism in detail.
Also on that card, in plain gray: Est. RMD: $776/mo. Nothing is wrong, so nothing is amber. It is simply telling you a requirement exists and is being met — which brings us to the next family.
Guardrail Family 3: Is a Penalty or Surcharge Coming?
The previous family costs you money you could have kept. This one costs you money you did not have to spend at all.
Required minimum distributions. From age 73 (75 if you were born in 1960 or later), the IRS requires a minimum withdrawal from tax-deferred accounts each year. Fall short and the penalty is 25% of the shortfall — reducible to 10% if corrected promptly, but still the harshest routine penalty in retirement.
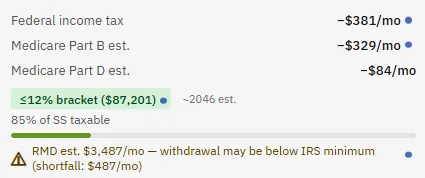
Compare this with the gray Est. RMD line in the previous image: same guardrail, different state. It stays quiet while you are compliant and turns amber with a specific shortfall figure when you are not. That is the pattern worth wanting from any warning system — silent until actionable, and specific when it speaks.
The trap here is subtle. RMDs catch people who did not need the money. If your income comes mostly from Social Security and a pension, you may have set a modest 401k withdrawal because that was all you wanted. The IRS does not care what you wanted. A plan that models the requirement tells you years ahead, while you still have options — spending the low-bracket space earlier through conversions, for instance, so the eventual RMD is smaller.
IRMAA. Above certain income levels, Medicare Part B and Part D premiums carry a surcharge. Two things make it unusually easy to walk into. First, it is a cliff, not a slope — one dollar over a tier boundary applies the whole surcharge. Second, it uses a two-year lookback: your premiums at 65 are set by your income at 63.
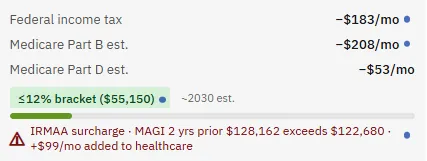
Note that the surcharge is shown as a real cost — +$99/mo added to healthcare — not merely flagged. That distinction matters. A warning badge that does not change your net income lets you dismiss it as a technicality; a surcharge that actually reduces the money you have to spend is a number you will weigh properly.
The lookback is what makes this hard to plan without help. At 63 you are pre-Medicare, deciding on a Roth conversion, and there is no Medicare premium in front of you to be affected. The consequence lands two years later. So the more valuable guardrail is the earlier one: a flag on the pre-Medicare phase saying, in effect, this year's income is the figure Medicare will read, and you are close.
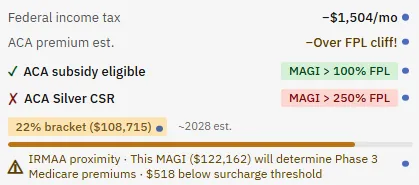
Read what that warning actually does. It appears on the phase where you can still act, names the later phase whose premiums it will set, gives the distance to the threshold, and points at the Roth conversion as a contributing factor — which is the input you were about to adjust anyway. Compare it with the red warning above: that one reports a surcharge you are already paying. This one describes a decision still in front of you. Same rule, and the amber version is worth far more.
Guardrail Family 4: Is This Really Enough?
The first three families ask whether the plan is legal, solvent, and efficient. This one asks whether it actually works for you, and it is the one people skip.

Two figures from the same phase. Nominal $2,959 a month — the dollars that arrive. Real $1,663 — what those dollars buy in today's money after 19.5 years of 3% inflation. The colors are the guardrail: amber for the first, red for the second.
That gap is not a rounding error. It is nearly half the purchasing power of the headline figure, and it is the single most common blind spot in a homemade retirement plan, because nominal dollars are what a spreadsheet naturally produces. A plan built on nominal figures does not fail suddenly; it works fine for a decade and then slowly stops being enough. This is why we treat gross, net, and real income as three different questions.
Thresholds like these are necessarily generic — a monthly figure that is comfortable in one place is tight in another. Which is why a plan should also let you set your own income target and check every phase against it.

$3,070 against a $3,500 target — 88%, amber. The important design decision is invisible here: that status follows the worst phase, not the average. An average would let a comfortable early retirement paper over a thin phase at 80, which is precisely the phase you needed to see.
Reading Guardrails Without Drowning in Them
A plan with thirty warnings is not more informative than one with three. Some practical habits:
Learn the color language first. Green means fine. Red means you have crossed something or run out of money. Amber means you are close to an edge. Amber is where the value is — red usually tells you about a decision you already made.
Scan by family, not by card. Solvency first (can it pay?), then penalties (is something coming?), then efficiency (am I overpaying?), then adequacy (is it enough?). A card can show a dozen flags; four questions is a manageable number.
Expect flags to arrive in clusters, and read the cluster. An unfunded expense brings depletion warnings with it. An ACA cliff usually brings a higher bracket. The pattern tells you more than any single flag, and it usually points at one underlying cause.
Treat a warning as a question, not an instruction. "Cash runs out at 69" is only a problem if you did not plan for it. Deliberately spending cash first to keep MAGI low for ACA purposes will produce that exact warning, and the plan is working as designed. The guardrail exists to make sure it was your intention.
Do not optimize every amber to green. Some are genuinely in tension. Keeping MAGI low protects cost-sharing reductions, but it also leaves a tax-deferred balance growing into a bigger future RMD and possible IRMAA exposure. You cannot silence both flags at once. Choosing which one to accept is the planning.
Why Guardrails Make Planning Easier, Not Harder
There is a reasonable objection here: does a plan covered in warnings not make retirement planning feel more intimidating?
In practice the opposite. Consider what you would otherwise need to know before you could plan confidently: the FPL thresholds and how cost-sharing tiers step, the Social Security taxability formula, the RMD divisor table and start age, the IRMAA tiers and the two-year lookback, and how every one of those is inflation-adjusted differently. That is a serious amount of homework, and it changes annually.
Guardrails invert the problem. You do not need to know the thresholds in advance — you need to recognize a color and read two numbers. The workflow becomes tight enough to describe in one line:
Change one number → scan for amber → click it → ask why.
That last step is where the learning happens, and it is why the badges are worth making clickable rather than decorative. A flag that just warns you teaches nothing. A flag that opens an explanation using your figures — this is your MAGI, this is the threshold for that year, here is the headroom, here is what would close it — teaches you the rule while you are motivated to learn it, because it is currently costing you money. In our planner each of those explanations also hands you a pre-written question for the AI assistant, so the natural next step needs no expertise to phrase. Asking better questions of a plan is a skill, and having the question drafted for you is a real shortcut.
Guardrails are also the honest answer to a fair criticism of planning software: that a confident-looking projection can hide how much it assumed. A plan that flags its own weak points is easier to trust than one that reports a single reassuring number, which is the same instinct behind checking a plan from several angles rather than trusting one result.
Then, when you want the whole picture at once rather than card by card, a Plan Health review collects the same signals into one list and ranks them.
Questions to Ask Your Plan
- Is any account being asked for more than it holds, in any phase?
- Did any account reach zero that I did not intend to spend down?
- In each pre-Medicare phase, how much MAGI headroom is left before the next healthcare threshold?
- Which phases still have low-bracket space, and am I using it?
- What share of my Social Security becomes taxable, and does an extra withdrawal change it?
- From my RMD age (73, or 75 if born in 1960 or later), does my planned withdrawal meet the required minimum?
- Which year's income sets my first Medicare premium, and how close is it to a surcharge tier?
- What is my real monthly income in the last phase, not the nominal figure?
- If I have an income target, which phase is furthest below it?
FAQ
What is a retirement plan guardrail?
A warning or status badge that appears on a retirement plan because of your own numbers, flagging that you are near or past a threshold that changes what you keep. Examples include an ACA subsidy cliff, an IRMAA surcharge tier, a required minimum distribution, or an account reaching zero. It is a signal to review a decision, not advice about what to do.
How is this different from withdrawal guardrails?
Withdrawal guardrails are spending rules you set in advance — for example, reduce discretionary spending 10% if the portfolio falls below a trigger level. They are a strategy for reacting to markets. The guardrails in this article are warnings a plan displays as you build it, based on tax, healthcare, and account thresholds. Different tools for different jobs; see our article on withdrawal guardrails for that approach.
Should I try to clear every warning?
No. Some warnings are the intended consequence of a deliberate choice, such as spending cash early to keep MAGI low. Others are in direct tension: keeping income low for ACA purposes can grow a future RMD. The goal is for every remaining flag to be one you understand and accepted, not zero flags.
Why does a warning appear before anything is wrong?
Because that is the only point at which it is free to act. Once income has crossed an ACA cliff or a lookback year has passed, the cost is fixed for that year. An amber warning showing your remaining headroom in dollars lets you adjust a withdrawal beforehand, which is why proximity warnings are usually more valuable than the warnings that fire after the fact.
Why do the threshold numbers on my plan not match the current published figures?
Tax brackets, standard deductions, FPL levels, and IRMAA tiers are adjusted over time. A projection for 2041 has to compare your 2041 income against an estimated 2041 threshold, so the figure shown for a later phase will be higher than today's published number. Any such adjustment is an assumption, so treat later-phase thresholds as estimates rather than facts.
Does an account reaching zero mean the plan failed?
Not necessarily. Spending one account down on purpose is a legitimate strategy — using cash as a bridge to Social Security, for example, or drawing a brokerage account first for tax reasons. What matters is whether the plan still pays you the income you need after it empties. That is why an account you deliberately excluded should look different from one your withdrawals drained.
What is the two-year lookback on Medicare surcharges?
Medicare income-related surcharges are generally based on your tax return from two years earlier, so income at 63 can affect premiums at 65. This is why a warning on a pre-Medicare phase — flagging that this year's income is the figure Medicare will read — is more useful than one that appears after the surcharge starts.
Source Links
- IRS, Retirement topics — required minimum distributions: https://www.irs.gov/retirement-plans/retirement-topics-required-minimum-distributions-rmds
- IRS, Publication 915 (Social Security and equivalent railroad retirement benefits): https://www.irs.gov/forms-pubs/about-publication-915
- IRS, Topic no. 558, additional tax on early distributions: https://www.irs.gov/taxtopics/tc558
- HealthCare.gov, Saving money on health insurance: https://www.healthcare.gov/lower-costs/
- HealthCare.gov, Cost-sharing reduction: https://www.healthcare.gov/glossary/cost-sharing-reduction/
- Medicare.gov, Part B costs: https://www.medicare.gov/basics/costs/medicare-costs
- Consumer Financial Protection Bureau, Planning for retirement: https://www.consumerfinance.gov/consumer-tools/retirement/
- AI Retirement Income Planner: https://airetirementincomeplanner.com/
Educational Disclaimer
This article is for general education only. It is not financial, tax, investment, legal, healthcare, Social Security, Medicare, insurance, or retirement advice. Tax brackets, standard deductions, federal poverty level figures, cost-sharing rules, Medicare costs, IRMAA tiers, and required minimum distribution rules change over time, and projected future thresholds are estimates that depend on assumptions which may not hold. Screenshots show a sample plan and are illustrative only. Verify important numbers and rules with official sources such as IRS.gov, HealthCare.gov, and Medicare.gov, and confirm decisions with a qualified professional before acting.